


Visualizing with Infographics
/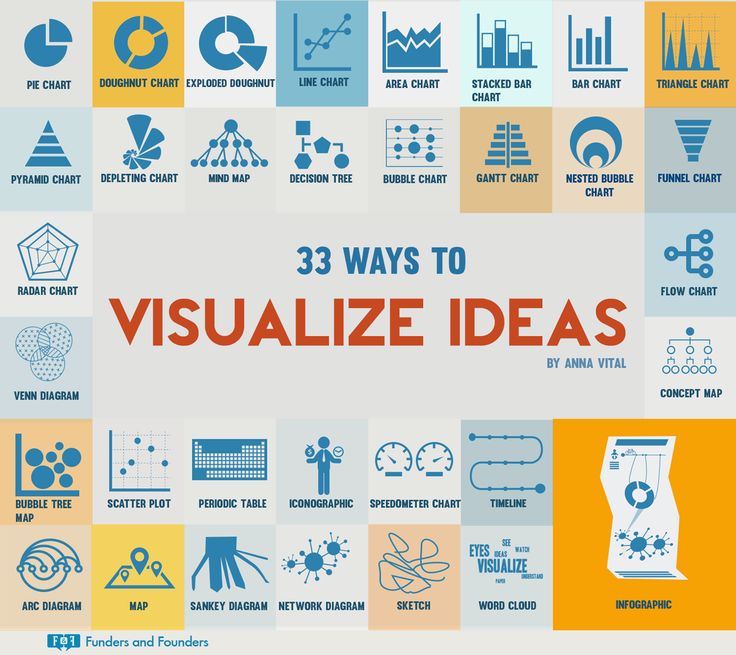
Information graphics are visual representations of information, data and knowledge. It is an ideal instrument to present or communicate complex information in a simple way. This makes it also a useful tool for learning and training. It quickly conveys knowledge and it engages viewers.

In comparison with the mindmapping technique the visual factor of infographics is more important. It includes usually visual elements such as signs, charts, maps, or diagrams that enhance comprehension of a given text-based content.
With this blogpost we would like to start to make an inventory/collection of learning and training infographs. To this end we will collect all infographs which are related in one way or another to the world of learning and training:
– Informal learning (Jay Cross)
– The four network layers and the cycle of engagement (Beyond the echo chamber)
– A metromap or a worldmap about social software tools
Can you add additional infographics?
For further reading:
– Defining infographs
– Creating infographs
For those who want to see a combination of infographics and storytelling, check out the Little Red Riding Hood Retold as an illustration.


[…] Visualizing with Infographics: This article focuses on an infographic entitled, “Informal Learning,” and states that, “In comparison with the mindmapping technique the visual factor of infographics is more important.” Follow this blog to learn more about infographs that are related in one way or another to the world of learning and training. […]